Archive for the ‘careers’ Category

Where do graduates come from and where do they go?

February 21st, 2019 by Graham Attwell

I’ve written too many times about the problems in sense making from data – particularly where the labour market and education are involved. This presentation from the UK Centre for Cities makes an admiral attempt to use the data to tell a story about where students are coming from to study at Glasgow’s Universities and where they go afterwards.

It has its drawbacks – mainly due to the lack of data. For instance most of the slides fail to show movements in and out of the UK. Also, I would have loved to have more detailed data about what jobs students go into after university, but this data just is not available from UCAS at a more disaggregated level. And I am not very sure about the click bait title: “the Great British Brain Drain.” If there is a brain drain, nothing in the analysis points to one.

It is interesting to see that manufacturing still accounts for 44% of new graduate employment is Glasgow, despite manufacturing only constituting 30% of total employment in the city. This is much more that the 19& of new graduate working in the much heralded knowledge intensive business services sector.

One of their conclusions is very important: its not just about the student experience or the quality of nightlife in a city but more importantly “Ultimately it’s the jobs available to graduates which determine if they stay. By offering more, and better, opportunities the city will attract more graduates, both those who have studied in the city and those moving in for the first time from elsewhere.”

Young people living with parents for longer

February 8th, 2019 by Graham Attwell

WONKHE reports there has been a significant rise in the number of 20 to 34-year-olds living with their parents in the UK, according to analysis of the Labour Force Survey by think tank Civitas.” The analysis, covered by the Financial Times, finds an increase of 791,600 under 35-year-olds living with their parents between 1996-8 and 2014-15. The rise has been noted in all UK regions, with the most pronounced results in London. Civitas puts the increase primarily down to the cost of housing, and suggests that HE participation could be a factor, as more young adults are financially dependent on their parents for longer.”

Th8s brings UK more into line with other countries in Europe, where young people tend to live at home with their parents until tehy are much older than has been in the UK. It also would be interesting to look at the figures (if available) for numbers of people studying at their home town university, rather than following the ‘rites of passage’ to move to college in another twon or city.

Developing a skills taxonomy

February 6th, 2019 by Graham Attwell

This morning’s mailing from the Marchmont Employment and Skills Observatory reports that NESTA have launched an interesting new Tool – a UK skills taxonomy:

“Skill shortages are costly and can hamper growth, but we don’t currently measure these shortages in a detailed or timely way. To address this challenge, we have developed the first data-driven skills taxonomy for the UK that is publicly available. A skills taxonomy provides a consistent way of measuring the demand and supply of skills. It can also help workers and students learn more about the skills that they need, and the value of those skills.” NESTA

It should help with careers guidance and is ideal for people looking at the return to differing career choices and how you get there. NESTA began with a list of just over 10,500 unique skills that had been mentioned within the descriptions of 41 million UK job adverts, collected between 2012 and 2017 and provided by Burning Glass Technologies. Machine learning was used to hierarchically cluster the skills. The more frequently two skills appeared in the same advert, the more likely it is that they ended up in the same branch of the taxonomy. The taxonomy therefore captures ‘the clusters of skills that we need for our jobs’.

The final taxonomy can be seen here and has a tree-like structure with three layers. The first layer contains 6 broad clusters of skills; these split into 35 groups, and then split once more to give 143 clusters of specific skills. Each of the approximately 10,500 skills lives within one of these 143 skill groups.

The skills taxonomy provide a rich set of data although requiring some work in interpretation. The six broad clusters of skills are:

The ten clusters (at the third layer) containing the most demanded skills are:

  1. Social work and caregiving
  2. General sales
  3. Software development
  4. Office administration
  5. Driving and automotive maintenance
  6. Business management
  7. Accounting and financial management
  8. Business analysis and IT projects
  9. Accounting administration
  10. Retail

The five skill clusters at the third layer with the highest annual median salaries are:

  1. Data engineering
  2. Securities trading
  3. IT security operations
  4. IT security standards
  5. Mainframe programming

The five clusters with the lowest salaries are:

  1. Premises security
  2. Medical administration
  3. Dental assistance
  4. Office administration
  5. Logistics administration

While the taxonomy is based on web data collected between 2012 and 2017, the approach has teh potential to be developed on the basis of real time data. And it is likely to be only one of a number of tools produced in the next two years using machine learning to analyse large data sets. The use of real-time data from web vacancies is receiving a lot of attention right now.

There is also interest in the idea of skills clusters in the ongoing debate over the impact of Artificial Intelligence on jobs and employment. Rather than whole occupations disappearing (and others surviving) it is more likely that the different skills required within occupations may change

Graduate Jobs

November 19th, 2018 by Graham Attwell

MPs on the UK House of Commons education committee have released a report titled “Value for Money in Higher Education.” They draw attention to figures from the Office for National Statistics (ONS) that indicated 49 percent of recent graduates (within five years of achieving their degree) were in non-graduate roles in 2017.

This is a significant increase over the proportion at the start of 2009, just after the 2008 financial crash, when 41 percent of recent graduates were in that position. It is matched by a very similar rise even among the population of graduates taken as a whole—including mature students—from 31 percent to 37 percent in the same years.

The report stated: “Higher education institutions must be more transparent about the labour market returns of their courses.” It came with the warning that “too many universities are not providing value for money, and … students are not getting good outcomes from the degrees for which so many of them rack up debt.”

As the title of the report implies, much of the attention on graduate employment is due to the political controversy over the funding of Higher Education in the UK and the cost of participation in degree courses.

But there is another issue which has received less attention: how graduate (and non graduate) jobs are defined.

The Office for National Statistics explains the classification system as follows

1.The skill level groups are created by grouping jobs together based on their occupation according to the Standard Occupation Classification (SOC) 2010 lower level groups. The occupation group is not available for some workers, these have been excluded from the total.

Occupations were grouped by the skill level required according to the following guidelines:

2,1. High – This skill level is normally acquired through a degree or an equivalent period of work experience. Occupations at this level are generally termed ‘professional’ or managerial positions, and are found in corporate enterprises or governments. Examples include senior government officials, financial managers, scientists, engineers, medical doctors, teachers and accountants.

2,2. Upper-middle – This skill level equates to competence acquired through post-compulsory education but not to degree level. Occupations found at this level include a variety of technical and trades occupations, and proprietors of small business. For the latter, significant work experience may be typical. Examples of occupations at this level include catering managers, building inspectors, nurses, police officers (sergeant and below), electricians and plumbers.

2,3. Lower-middle – This skill level covers occupations that require the same competence acquired through compulsory education, but involve a longer period of work-related training and experience. Examples of occupations at this level include machine operation, driving, caring occupations, retailing, and clerical and secretarial occupations.

2,4. Low – This skill level equates to the competence acquired through compulsory education. Job-related competence involves knowledge of relevant health and safety regulations and may be acquired through a short period of training. Examples of occupations at this level include postal workers, hotel porters, cleaners and catering assistants.

The sentence “Occupations at this level are generally termed ‘professional’ or managerial positions, and are found in corporate enterprises or governments.” Arguably this ignores ongoing changes in the economy with high skilled technical jobs being created by Small and Medium Enterprises rather than large corporations. As Malcolm Todd,  Provost (Academic) of the University of Derby, points out in an article in WonkHE: “The current government methodology of using traditional Standard Occupational Codes (SOC) to declare which roles are graduate level is dated. It’s not reflective of the current employment market and is not ready for the future job market. Codes are based on traditional views of careers and highly skilled roles, not the whole requirements of a role.”

He draws attention to Teaching Assistants working with pupils that have special education needs and disabilities, and emerging jobs in the growing retail, social care and hospitality, many of which require high skills but are classified as non graduate jobs. At the same time, jobs presently classified as requiring a degree such as accountants are like to decline due to automation and the use of Artificial Intelligence.

To some degree, the debate is clouded by a perception that graduate level jobs should command a higher salary (an argument used by the Government to justify high university tuition fees. Yet wage growth in the UK has been low across all sectors since the onset of the recession in 2008.

But with growing skills required in a range of different jobs, maybe it is time for a new look at how graduate jobs are classified or even whether dividing employment into graduate or non graduate occupations is relevant any more.


Leaving home

October 1st, 2018 by Graham Attwell

living at homeI’ve had this graphic hanging around for quite a while, so it may be out of date. I think the point of it is that like much data the figures are fascinating but it is quite difficult to interpret. Why do boys leave home earlier than girls? Why is there such a big difference between countries. Although obviously there will be differences between those countries where young people normally leave home to go to university and those where they usually move to another town or city. And I am sure some of it is explained by socio- economic factors. It costs money to leave home. But I am not sure this explains it all. I would be very interested in anyone else’s perspective on this data.

The development of Labour Market Information systems

August 29th, 2018 by Graham Attwell

Over the past few years, part of my work has been involved in the design and development of Labour Market Information Systems. But just as with any facet of using new technologies, there is a socio-technical background to the emergence and use of new systems.

Most countries today have a more or less elaborated Labour Market Information system. In general, we can trace three phases in the development of these systems (Markowitch, 2017). Until the 1990s, Labour Market Information systems, and their attendant classification systems, mainly provided statistics for macroeconomic analysis, policy and planning. Between the 1990s and 2005 they were extended to provide data around the structuring and functioning of the Labour markets.

Mangozho (2003) attributes the change as a move from an industrial society to a post-industrial society (and the move to transition economies in Eastern Europe). Such a definition may be contentious, but he usefully charts changes in Labor market structures which give rise to different information needs. “While previously, the economic situation (especially the job structure) was relatively stable, in the latter phase the need for LMI increases because the demand for skills and qualifications changes fundamentally; the demand for skills / qualifications changes constantly, and because of these changes, Vocational Education and Training (VET) system has to be managed more flexibly (ETF, 1998)’.

He says: “In the industrial/pre-transition periods:

  • The relationship between the education and training system and the Labor market was more direct.
  • Occupational structures changed very slowly and as such, the professional knowledge and skills could easily be transferred.
  • Planning, even for short-term courses, could be done well in advance, and there was no need to make any projections about the future demands of occupations
  • The types of subjects and the vocational content required for specific jobs were easily identifiable.
  • There was little need for flexibility or to design tailor-made courses.
  • The education system concentrated on abstract and theoretical knowledge as opposed to practical knowledge.
  • Steady economic growth made it possible for enterprises to invest in on the job training.
  • There was less necessity to assess the relevance and adequacy of the VET system because it was deemed as adequate.
  • A shortage of skills could easily be translated into an increase of the number of related training institutions or student enrolments without necessarily considering the cost effectiveness of such measures. (Sparreboom, T, 1999).
  • Immediate employment was generally available for those who graduated from the education and training systems.”

Changes in the structure and functioning of Labour markets and the VET systems led to a greater need for comprehensive LMI to aid in the process of interpreting these structural shifts and designing effective HRD policies and programs, which provide for more linkages between the education and training systems and the Labor market.

At the same time, the reduction in the role of the state as a major employment provider and the development of market economies gave impetus to the need for a different approach to manpower planning, where the results of Labor market analysis as well as market based signals of supply and demand for skills are made available to the various economic agents responsible for the formulation and implementation of manpower and employment policies and programmes.

This led to the establishment of formal institutions to co-ordinate the generation of LMI, for instance internet based Labour Market Information Systems and the setting up of Labour Market Observatories and the development of more tangible LMI products, which provide a broad up, dated knowledge of the developments on the Labour market for different users.

Since 2005, Labour Market Information systems have been once more extended to incorporate both matching of jobs to job seekers and matching of supply and demand within Labour markets, particularly related to skills.

Four domains of learning

August 6th, 2018 by Graham Attwell

four development domaninspng

I came upon this text today when I was seeking to extend on an article I was writing that included the idea of learning in four domains. It was produced, I think, for the EmployID MOOC on the Changing World of Work and was probably written by Alan Brown and Jenny Bimrose.Sadly, I was so tied up with producing my own materials for the MOOC and didn’t get to read all of the other peoples. But at a time when there is a growing need to question to division between humanities and technical subjects, I think this offers a good way forward.

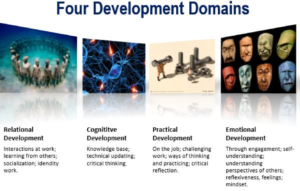
Relational development – learning with and from interacting with other people

A major route for relational development is learning through interactions at work, learning with and from others (in multiple contexts) and learning as participation in communities of practice (and communities of interest) while working with others. Socialisation at work, peer learning and identity work all contribute to individuals’ relational development. Many processes of relational development occur alongside other activities but more complex relationships requiring the use of influencing skills, engaging people for particular purposes, supporting the learning of others and exercising supervision, management or (team) leadership responsibilities may benefit from support through explicit education, training or development activities.

Jack from the UK had switched career and now who worked as a carer. From the outset Jack learned much about his work from engaging with residents in the care home as well as learning from other staff. He had received letters from residents expressing their gratitude, which had boosted his confidence. His manager encouraged him to become a trainer in the care home, and although nervous and unsure he delivered the training and his self-efficacy increased.

Cognitive development – acquiring knowledge and thinking skills

A major work-related route for cognitive development involves learning through mastery of an appropriate knowledge base and any subsequent technical updating. This form of development makes use of learning by acquisition and highlights the importance of subject or disciplinary knowledge and/or craft and technical knowledge, and it will be concerned with developing particular cognitive abilities, such as critical thinking; evaluating; synthesising etc.

Bernard, a Czech automotive worker, participated in a short internal company technical training programme which positively surprised him in terms of practical outcomes and motivated him to actively work on his vocational development. ‘You had to know your stuff, the trainer was extremely competent, he knew his field very well, but sometimes I had difficulties to follow him. Anyway, it was really done by professionals who knew their stuff, and I appreciated it very much. I was very satisfied. I learned lots of things that were later very useful for my work […] It was very interesting to meet people from a completely different and a rather specialised area. I learned a lot of things and I was proud of it. I think this was the moment that made me change my attitude towards learning. I became much more curious.’

Practical development – learning by doing, by experience, by taking on challenges

For practical development the major developmental route is often learning on the job, particularly learning through challenging work. Learning a practice is also about relationships, identity and cognitive development but there is value in drawing attention to this idea, even if conceptually it is a different order to the other forms of development highlighted in this representation of learning as a process of identity development. Practical development can encompass the importance of critical inquiry, innovation, new ideas, changing ways of working and (critical) reflection on practice. It may be facilitated by learning through experience, project work and/or by use of particular approaches to practice, such as planning and preparation, implementation (including problem-solving) and evaluation. The ultimate goal may be vocational mastery, with progressive inculcation into particular ways of thinking and practising, including acceptance of appropriate standards, ethics and values, and the development of particular skill sets and capabilities associated with developing expertise.

Davide, an Italian carpenter, saw learning as a practice-based process driven by curiosity, a spirit of observation, and trial and error. A major role was played by his passion for the transformation of matter, which he perceived as an almost sacred event: ‘It really struck me to see that from a piece of wood one can create a piece of furniture’.

Emotional development – making sense of your own feelings and how others feel 

For emotional development, the major developmental routes are learning through engagement,  reflexiveness that leads to greater self-understanding, and the development of particular personal qualities. Much emotional development may occur outside work, but the search for meaning in work, developing particular mind-sets, and mindfulness may be components of an individual’s emotional development. Particular avenues of development could include understanding the perspectives of others, respect for the views of others, empathy, anticipating the impact of your own words and actions, and a general reflexiveness, which includes exploring feelings. Identity development at work may also be influenced by changing ideas individuals have about their own well-being and changing definitions of career success (Brown & Bimrose 2014).

Henrik from Denmark switched career, moving into caring and developed a new relationship with his work, which he found much more emotionally engaging. While studying for his skilled worker qualification, Henrik immersed himself in individual assignments of his own choice. In one assignment, he developed a ‘product’ to help improve a pupil’s ability to communicate, an ability which was being lost due to a rare disease. When Henrik talked about the assignment he was very engaged and showed insight into the syndrome. Because the assignment was closely related to his experience and practice, he saw meaning in undertaking it: ‘It was as though there was a circle I could complete on my own.’ He received a top grade for the assignment, and it is evident that positive learning experiences and the perception of entering into learning processes that are meaningful to his life and work situation are strong motivating factors in his engagement in further learning.
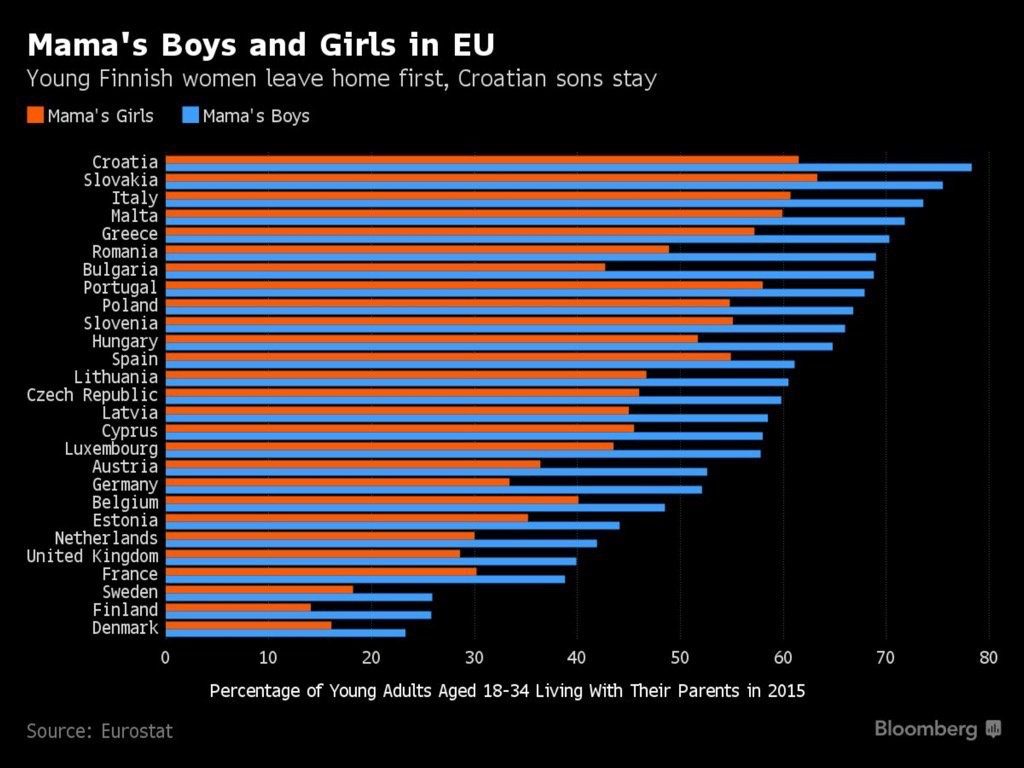
Data and the future of universities

August 2nd, 2018 by Graham Attwell

I’ve been doing quite a lot of thinking about how we use data in education. In the last few years two things have combined – the computing ability to collect and analyse large datasets, allied to the movement by many governments and administrative bodies towards open data.

Yet despite all the excitement and hype about the potential of using such data in education, it isn’t as easy as it sounds. I have written before about issues with Learning Analytics – in particular that is tends to be used for student management rather than for improving learning.

With others I have been working on how to use data in careers advice, guidance and counselling. I don’t envy young people today in trying to choose and  university or college course and career. Things got pretty tricky with the great recession of 2009. I think just before the banks collapsed we had been putting out data showing how banking was one of the fastest growing jobs in the UK. Add to the unstable economies and labour markets, the increasing impact of new technologies such as AI and robotics on future employment and it is very difficult for anyone to predict the jobs of the future. And the main impact may well be nots o much in new emerging occupations,or occupations disappearing but in the changing skills and knowledge required n different jobs.

One reaction to this from many governments including the UK has been to push the idea of employability. To make their point, they have tried to measure the outcomes of university education. But once more, just as student attainment is used as a proxy for learning in many learning analytics applications, pay is being used as a proxy for employability. Thus the Longitudinal Education Outcomes (LEO) survey, an experimental survey in the UK, users administrative data to measure the pay of graduates after 3, 5 and 0 years, per broad subject grouping per university. The trouble is that the survey does not record the places where graduates are working. And once thing we know for a certainty is that pay in most occupations in the UK is very different in different regions. The LEO survey present a wealth of data. But it is pretty hard to make any sense of it. A few things stand out. First is that UK labour markets look pretty chaotic. Secondly there are consistent gender disparities for graduates of the same subject group form individual universities. The third point is that prior attainment before entering university seems a pretty good predictor of future pay, post graduation. And we already know that prior attainment is closely related to social class.

A lot of this data is excellent for research purposes and it is great that it is being made available. But the collection and release of different data sets may also be ideologically determined in what we want potential students to be able to find out. In the same way by collecting particular data, this is designed to give a strong steer to the directions universities take in planning for the future. It may well be that a broader curriculum and more emphasis on process and learning would most benefits students. Yet the steer towards employability could be seen to encourage a narrower focus on the particular skills and knowledge employers say they want in the short term and inhibit the wider debates we should be having around learning and social inclusion.


Learning about Careers: Open data and Labour Market Intelligence

August 1st, 2018 by Graham Attwell

I’ve spent a lot of the last two months writing papers. I am not really sure why – other than people keep asking me to and I really do have a built up load of things which I haven’t written about. But one bad consequence of all this is I seem to have abandoned this blog. So,  time to start catching up here.

This paper – Learning about Careers: Open data and Labour Market Intelligence – is co-written with Deirdre Hughes. It is a preprint and wil be published in RIED – Revista Iboeroamericana de Educación a Distancia (The Iberoamerican Review of Digital Education) some time soon.

The full paper can be found on Research Gate or alternatively you can download it here. The abstract is as follows:

“Decisions about learning and work have to be placed in a particular spatial, labour market and socio-cultural context – individuals are taking decisions within particular ‘opportunity structures’ and their decisions and aspirations are further framed by their understanding of such structures. This article examines ways in which learning about careers using open data and labour market intelligence can be applied. An illustrative case study of the LMI for All project in the UK shows the technical feasibility of designing and developing such systems and a model for dissemination and impact. The movement towards Open Data and increasingly powerful applications for processing and querying data has gathered momentum. This combined with the need for labour market information for decision making in increasingly unstable labour markets have led to the development and piloting of new LMI systems, involving multiple user groups. Universal challenges exist given the increasing use of LMI, especially in job matching and the rapidly expanding use of open source data in differing education and employment settings. We highlight at least six emergent issues that have to be addressed so that open data and labour market intelligence can be applied effectively in differing contexts and settings. We conclude by reflecting on the urgent need to extend the body of research and to develop new methods of co-constructing in innovative collaborative partnerships.”


Are job algorithms good enough?

February 22nd, 2018 by Graham Attwell

We’ve all made jokes about the jobs that various ‘professional’ social networks recommend for us.  This morning I had a message from ResearchGate:

LinkedIn is no better. Here are tworesearchgate jobs it recently found for me:

linkedin

Goodness knows how they  vaguely thought I was qualified for these jobs. But never mind – it is only the usual nonsense form free social networks, we think. But it does matter. These reconsiderations come through algorithms. And nearly every Public Employment Service I have talked to is either trialling or considering trialling software which matches applicants to jobs. OK, the algorithms may be better written. And probably the employment services have more data on both applicants and jobs that has the likes of ReseachGate and LinkedIn. But in seeking to provide a better service at less cost through the use of technology the employment services are ignoring that many people need guidance and support when seeking employment form qualified professionals. Taking a job is not like ticking a like on a social website.  It involves serious decisions which can affect peoples futures and the future of their family.  And, at the moment, Artifical Intelligence is not enough for helping in those decisions.

  • Search Pontydysgu.org

    Social Media


    News Bites

    Cyborg patented?

    Forbes reports that Microsoft has obtained a patent for a “conversational chatbot of a specific person” created from images, recordings, participation in social networks, emails, letters, etc., coupled with the possible generation of a 2D or 3D model of the person.


    Racial bias in algorithms

    From the UK Open Data Institute’s Week in Data newsletter

    This week, Twitter apologised for racial bias within its image-cropping algorithm. The feature is designed to automatically crop images to highlight focal points – including faces. But, Twitter users discovered that, in practice, white faces were focused on, and black faces were cropped out. And, Twitter isn’t the only platform struggling with its algorithm – YouTube has also announced plans to bring back higher levels of human moderation for removing content, after its AI-centred approach resulted in over-censorship, with videos being removed at far higher rates than with human moderators.


    Gap between rich and poor university students widest for 12 years

    Via The Canary.

    The gap between poor students and their more affluent peers attending university has widened to its largest point for 12 years, according to data published by the Department for Education (DfE).

    Better-off pupils are significantly more likely to go to university than their more disadvantaged peers. And the gap between the two groups – 18.8 percentage points – is the widest it’s been since 2006/07.

    The latest statistics show that 26.3% of pupils eligible for FSMs went on to university in 2018/19, compared with 45.1% of those who did not receive free meals. Only 12.7% of white British males who were eligible for FSMs went to university by the age of 19. The progression rate has fallen slightly for the first time since 2011/12, according to the DfE analysis.


    Quality Training

    From Raconteur. A recent report by global learning consultancy Kineo examined the learning intentions of 8,000 employees across 13 different industries. It found a huge gap between the quality of training offered and the needs of employees. Of those surveyed, 85 per cent said they , with only 16 per cent of employees finding the learning programmes offered by their employers effective.


    Other Pontydysgu Spaces

    • Pontydysgu on the Web

      pbwiki
      Our Wikispace for teaching and learning
      Sounds of the Bazaar Radio LIVE
      Join our Sounds of the Bazaar Facebook goup. Just click on the logo above.

      We will be at Online Educa Berlin 2015. See the info above. The stream URL to play in your application is Stream URL or go to our new stream webpage here SoB Stream Page.

  • Twitter

  • Recent Posts

  • Archives

  • Meta

  • Categories