Archive for the ‘Data’ Category

Understanding data about society

May 29th, 2019 by Graham Attwell

I have often written about the problems in interpreting and making sense of data. I very much like an article ‘What drives anti-migrant attitudes‘ by and published on the Social Europe Site yesterday.

They analysed data from the European Social Survey (ESS)—a biannual survey of Europe’s societies and people’s attitudes since 2002and looking at how people think about migration and migrants. They say: “It is not the presence of migrants as such that generates anti-migrant sentiments: these are strongest in countries with very few migrants. Similarly, on an individual level there is a strong negative correlation between personal contact with migrants and attitudes.”

“The analysis of the data showed that more general societal processes are more likely to shape attitudes: the level of trust in one another and in state institutions, the perception of social cohesion and the feeling of safety in a direct (physical) and indirect (existential) sense. We found that individuals who rejected migrants, extremely and homogeneously, did not differ in demographic characteristics from the rest of the population. Where they did differ was in their subjective perceptions of control: to a much greater extent, they feel they have financial difficulties, are alienated from politics, lack trust and hold security-focused, individualistic values. All in all, people who feel politically disempowered, financially insecure and without social support are the most likely to become extremely negative towards migrants.”

The European Social survey is a time series survey. This allows comparison with earlier results. Messing and Sagvari found a similar pattern in looking at changing attitudes over time. Those countries in which people are more trusting of public institutions, and more satisfied with the performance of their governments, democratic institutions and national economies, are the most likely to be more accepting of migrants.

Where do graduates come from and where do they go?

February 21st, 2019 by Graham Attwell

I’ve written too many times about the problems in sense making from data – particularly where the labour market and education are involved. This presentation from the UK Centre for Cities makes an admiral attempt to use the data to tell a story about where students are coming from to study at Glasgow’s Universities and where they go afterwards.

It has its drawbacks – mainly due to the lack of data. For instance most of the slides fail to show movements in and out of the UK. Also, I would have loved to have more detailed data about what jobs students go into after university, but this data just is not available from UCAS at a more disaggregated level. And I am not very sure about the click bait title: “the Great British Brain Drain.” If there is a brain drain, nothing in the analysis points to one.

It is interesting to see that manufacturing still accounts for 44% of new graduate employment is Glasgow, despite manufacturing only constituting 30% of total employment in the city. This is much more that the 19& of new graduate working in the much heralded knowledge intensive business services sector.

One of their conclusions is very important: its not just about the student experience or the quality of nightlife in a city but more importantly “Ultimately it’s the jobs available to graduates which determine if they stay. By offering more, and better, opportunities the city will attract more graduates, both those who have studied in the city and those moving in for the first time from elsewhere.”

Young people living with parents for longer

February 8th, 2019 by Graham Attwell

WONKHE reports there has been a significant rise in the number of 20 to 34-year-olds living with their parents in the UK, according to analysis of the Labour Force Survey by think tank Civitas.” The analysis, covered by the Financial Times, finds an increase of 791,600 under 35-year-olds living with their parents between 1996-8 and 2014-15. The rise has been noted in all UK regions, with the most pronounced results in London. Civitas puts the increase primarily down to the cost of housing, and suggests that HE participation could be a factor, as more young adults are financially dependent on their parents for longer.”

Th8s brings UK more into line with other countries in Europe, where young people tend to live at home with their parents until tehy are much older than has been in the UK. It also would be interesting to look at the figures (if available) for numbers of people studying at their home town university, rather than following the ‘rites of passage’ to move to college in another twon or city.

AI and education

February 6th, 2019 by Graham Attwell

Fear you are going to be seeing this headline quite a bit in coming months. And like everyone else I am getting excited and worried about the possibilities of AI for learning – and less so for AI in education management.

Anyway here is the promise from an EU Horizon 2020 project looking mainly at ethics in AI. As an aside, while lots of people seem to be looking at ethics, which f course is very welcome, I see less research into the potentials and possibilities of AI (more to follow).

The SHERPA consortium – a group consisting of 11 members from six European countries – whose mission is to understand how the combination of artificial intelligence and big data analytics will impact ethics and human rights issues today, and in the future.

One of F-Secure’s (a partner in the project) first tasks will be to study security issues, dangers, and implications of the use of data analytics and artificial intelligence, including applications in the cyber security domain. This research project will examine:

  • ways in which machine learning systems are commonly mis-implemented (and recommendations on how to prevent this from happening)
  • ways in which machine learning models and algorithms can be adversarially attacked (and mitigations against such attacks)
  • how artificial intelligence and data analysis methodologies might be used for malicious purposes

Graduate Jobs

November 19th, 2018 by Graham Attwell

MPs on the UK House of Commons education committee have released a report titled “Value for Money in Higher Education.” They draw attention to figures from the Office for National Statistics (ONS) that indicated 49 percent of recent graduates (within five years of achieving their degree) were in non-graduate roles in 2017.

This is a significant increase over the proportion at the start of 2009, just after the 2008 financial crash, when 41 percent of recent graduates were in that position. It is matched by a very similar rise even among the population of graduates taken as a whole—including mature students—from 31 percent to 37 percent in the same years.

The report stated: “Higher education institutions must be more transparent about the labour market returns of their courses.” It came with the warning that “too many universities are not providing value for money, and … students are not getting good outcomes from the degrees for which so many of them rack up debt.”

As the title of the report implies, much of the attention on graduate employment is due to the political controversy over the funding of Higher Education in the UK and the cost of participation in degree courses.

But there is another issue which has received less attention: how graduate (and non graduate) jobs are defined.

The Office for National Statistics explains the classification system as follows

1.The skill level groups are created by grouping jobs together based on their occupation according to the Standard Occupation Classification (SOC) 2010 lower level groups. The occupation group is not available for some workers, these have been excluded from the total.

Occupations were grouped by the skill level required according to the following guidelines:

2,1. High – This skill level is normally acquired through a degree or an equivalent period of work experience. Occupations at this level are generally termed ‘professional’ or managerial positions, and are found in corporate enterprises or governments. Examples include senior government officials, financial managers, scientists, engineers, medical doctors, teachers and accountants.

2,2. Upper-middle – This skill level equates to competence acquired through post-compulsory education but not to degree level. Occupations found at this level include a variety of technical and trades occupations, and proprietors of small business. For the latter, significant work experience may be typical. Examples of occupations at this level include catering managers, building inspectors, nurses, police officers (sergeant and below), electricians and plumbers.

2,3. Lower-middle – This skill level covers occupations that require the same competence acquired through compulsory education, but involve a longer period of work-related training and experience. Examples of occupations at this level include machine operation, driving, caring occupations, retailing, and clerical and secretarial occupations.

2,4. Low – This skill level equates to the competence acquired through compulsory education. Job-related competence involves knowledge of relevant health and safety regulations and may be acquired through a short period of training. Examples of occupations at this level include postal workers, hotel porters, cleaners and catering assistants.

The sentence “Occupations at this level are generally termed ‘professional’ or managerial positions, and are found in corporate enterprises or governments.” Arguably this ignores ongoing changes in the economy with high skilled technical jobs being created by Small and Medium Enterprises rather than large corporations. As Malcolm Todd,  Provost (Academic) of the University of Derby, points out in an article in WonkHE: “The current government methodology of using traditional Standard Occupational Codes (SOC) to declare which roles are graduate level is dated. It’s not reflective of the current employment market and is not ready for the future job market. Codes are based on traditional views of careers and highly skilled roles, not the whole requirements of a role.”

He draws attention to Teaching Assistants working with pupils that have special education needs and disabilities, and emerging jobs in the growing retail, social care and hospitality, many of which require high skills but are classified as non graduate jobs. At the same time, jobs presently classified as requiring a degree such as accountants are like to decline due to automation and the use of Artificial Intelligence.

To some degree, the debate is clouded by a perception that graduate level jobs should command a higher salary (an argument used by the Government to justify high university tuition fees. Yet wage growth in the UK has been low across all sectors since the onset of the recession in 2008.

But with growing skills required in a range of different jobs, maybe it is time for a new look at how graduate jobs are classified or even whether dividing employment into graduate or non graduate occupations is relevant any more.


Data literacy and participation in adult education

October 17th, 2018 by Graham Attwell

DavidPollardIRL_2018-Oct-15I am ever more interested in the issue of data literacy and agree very much with Javiera Atenas from the Open Education Working Group, London who says “Learning how to use data and information is not just a subject among others, it’s an essential part of civic education.”

But it is not just learning how to use data and information. Perhaps more critical is how to understand and make critical sense out of data. Take the chart above as an example. The difference in participation in adult education are very substantial and on the face of it Nordic countries lead the way. Interesting too that Germany is well back in the middle of the pack. However I am not sure it is quite as it seems. I suspect the data is compiled from national data by Eurostat from the European Labour Force Survey. The issue may be that different countries classify participation in education in different ways.

When I get a free hour or so I wil try to follow this up. Meanwhile any comments and ideas from readers would be welcome.

Leaving home

October 1st, 2018 by Graham Attwell

living at home
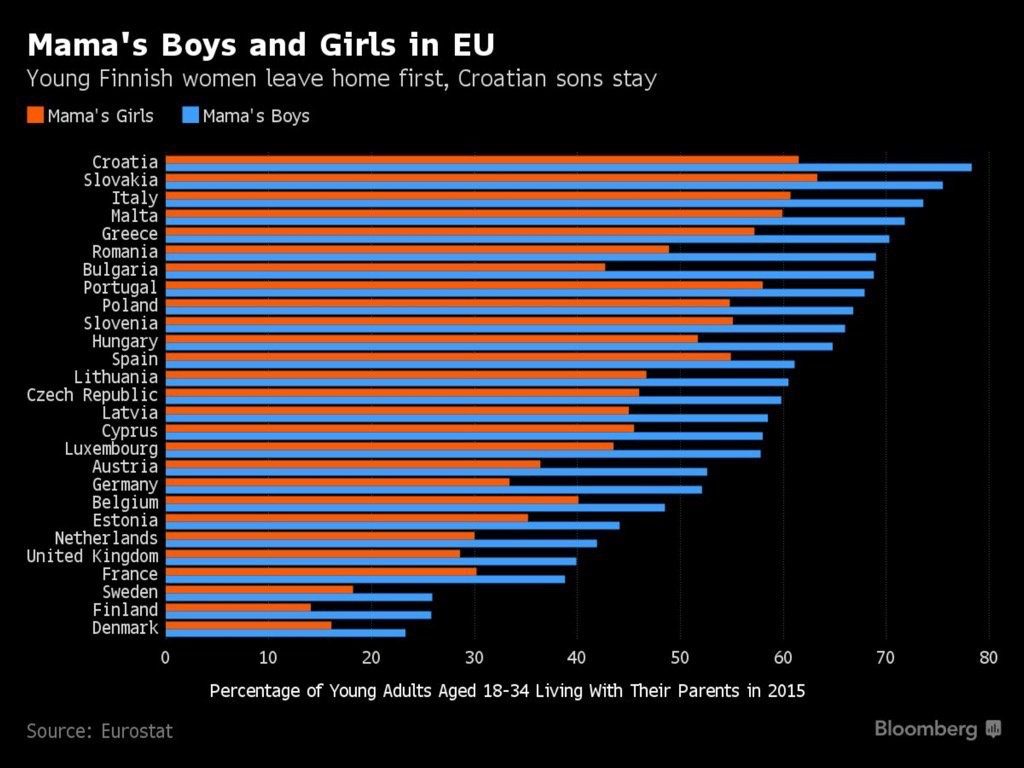
I’ve had this graphic hanging around for quite a while, so it may be out of date. I think the point of it is that like much data the figures are fascinating but it is quite difficult to interpret. Why do boys leave home earlier than girls? Why is there such a big difference between countries. Although obviously there will be differences between those countries where young people normally leave home to go to university and those where they usually move to another town or city. And I am sure some of it is explained by socio- economic factors. It costs money to leave home. But I am not sure this explains it all. I would be very interested in anyone else’s perspective on this data.

Data and the future of universities

August 2nd, 2018 by Graham Attwell

I’ve been doing quite a lot of thinking about how we use data in education. In the last few years two things have combined – the computing ability to collect and analyse large datasets, allied to the movement by many governments and administrative bodies towards open data.

Yet despite all the excitement and hype about the potential of using such data in education, it isn’t as easy as it sounds. I have written before about issues with Learning Analytics – in particular that is tends to be used for student management rather than for improving learning.

With others I have been working on how to use data in careers advice, guidance and counselling. I don’t envy young people today in trying to choose and  university or college course and career. Things got pretty tricky with the great recession of 2009. I think just before the banks collapsed we had been putting out data showing how banking was one of the fastest growing jobs in the UK. Add to the unstable economies and labour markets, the increasing impact of new technologies such as AI and robotics on future employment and it is very difficult for anyone to predict the jobs of the future. And the main impact may well be nots o much in new emerging occupations,or occupations disappearing but in the changing skills and knowledge required n different jobs.

One reaction to this from many governments including the UK has been to push the idea of employability. To make their point, they have tried to measure the outcomes of university education. But once more, just as student attainment is used as a proxy for learning in many learning analytics applications, pay is being used as a proxy for employability. Thus the Longitudinal Education Outcomes (LEO) survey, an experimental survey in the UK, users administrative data to measure the pay of graduates after 3, 5 and 0 years, per broad subject grouping per university. The trouble is that the survey does not record the places where graduates are working. And once thing we know for a certainty is that pay in most occupations in the UK is very different in different regions. The LEO survey present a wealth of data. But it is pretty hard to make any sense of it. A few things stand out. First is that UK labour markets look pretty chaotic. Secondly there are consistent gender disparities for graduates of the same subject group form individual universities. The third point is that prior attainment before entering university seems a pretty good predictor of future pay, post graduation. And we already know that prior attainment is closely related to social class.

A lot of this data is excellent for research purposes and it is great that it is being made available. But the collection and release of different data sets may also be ideologically determined in what we want potential students to be able to find out. In the same way by collecting particular data, this is designed to give a strong steer to the directions universities take in planning for the future. It may well be that a broader curriculum and more emphasis on process and learning would most benefits students. Yet the steer towards employability could be seen to encourage a narrower focus on the particular skills and knowledge employers say they want in the short term and inhibit the wider debates we should be having around learning and social inclusion.


Living in an Algorithmic World

May 4th, 2018 by Graham Attwell

This video is from Danah Boyd’s opening keynote for the re:publica 18 conference. Although it is an hour long it is well worth watching. Danah says “Algorithmic technologies that rely on data don’t necessarily support a social world that many of us want to live in. We must grapple with the biases embedded in and manipulation of these systems, particularly when so many parts of society are dependent on sociotechnical systems.” That goes for education just as much as any other part of the social world.

Designing Learner Dashboards

May 2nd, 2018 by Graham Attwell


The UK Jisc are really good at producing on line reports of workshops and meetings (something which I am not!). This is one of the presentations from the Student Experience Experts Group meeting, two of which  events held every year to share the work of the student experience team at Jisc and to offer opportunities for feedback and consultation on current activities. The Jisc web page provides a brief summary of the meeting and all of the presentations. I picked this one by Liz Bennett from the University of Huddersfield because the issue of how to design dashboards is one which perplexes me at the moment.

  • Search Pontydysgu.org

    Social Media


    News Bites

    Cyborg patented?

    Forbes reports that Microsoft has obtained a patent for a “conversational chatbot of a specific person” created from images, recordings, participation in social networks, emails, letters, etc., coupled with the possible generation of a 2D or 3D model of the person.


    Racial bias in algorithms

    From the UK Open Data Institute’s Week in Data newsletter

    This week, Twitter apologised for racial bias within its image-cropping algorithm. The feature is designed to automatically crop images to highlight focal points – including faces. But, Twitter users discovered that, in practice, white faces were focused on, and black faces were cropped out. And, Twitter isn’t the only platform struggling with its algorithm – YouTube has also announced plans to bring back higher levels of human moderation for removing content, after its AI-centred approach resulted in over-censorship, with videos being removed at far higher rates than with human moderators.


    Gap between rich and poor university students widest for 12 years

    Via The Canary.

    The gap between poor students and their more affluent peers attending university has widened to its largest point for 12 years, according to data published by the Department for Education (DfE).

    Better-off pupils are significantly more likely to go to university than their more disadvantaged peers. And the gap between the two groups – 18.8 percentage points – is the widest it’s been since 2006/07.

    The latest statistics show that 26.3% of pupils eligible for FSMs went on to university in 2018/19, compared with 45.1% of those who did not receive free meals. Only 12.7% of white British males who were eligible for FSMs went to university by the age of 19. The progression rate has fallen slightly for the first time since 2011/12, according to the DfE analysis.


    Quality Training

    From Raconteur. A recent report by global learning consultancy Kineo examined the learning intentions of 8,000 employees across 13 different industries. It found a huge gap between the quality of training offered and the needs of employees. Of those surveyed, 85 per cent said they , with only 16 per cent of employees finding the learning programmes offered by their employers effective.


    Other Pontydysgu Spaces

    • Pontydysgu on the Web

      pbwiki
      Our Wikispace for teaching and learning
      Sounds of the Bazaar Radio LIVE
      Join our Sounds of the Bazaar Facebook goup. Just click on the logo above.

      We will be at Online Educa Berlin 2015. See the info above. The stream URL to play in your application is Stream URL or go to our new stream webpage here SoB Stream Page.

  • Twitter

  • Recent Posts

  • Archives

  • Meta

  • Categories