Archive for the ‘Data’ Category

Student satisfaction unrelated to learning behaviour and academic performance

March 13th, 2018 by Graham Attwell

I seem to spend a lot of time lately moaning about bad data practices. About approaches to learning analytics which appear to be based on looking at what data is available and the trying to think out what the question is. And particularly over the different proxies we use for learning.

So, I particularly liked the report in THE of the inaugural lecture by Professor Rienties at the UK Open Universitity’s Institute of Educational Technology. Professor Rienties outlined the results of a study that examined data on 111,256 students on 151 different modules at his institution. He found that student satisfaction, one of the most common used proxies for learning and achievement, is “unrelated” to learning behaviour and academic performance. According to THE:

Significantly higher student satisfaction was found in modules in which students received large amounts of learning materials and worked through them individually, than in courses where students had to collaborate and work together.

However, the best predictor for whether students actually passed the module was whether there were collaborative learning activities, such as discussion forums and online tuition sessions.

Students who were “spoon-fed” learning materials also spent less time in the virtual learning environment, were less engaged, and were less likely to remain active over time than their peers engaged in more collaborative activities.
Happy birthday, Graham Attwell!

February 16th, 2018 by Pekka Kamarainen

Today the fellow-bloggers on Pontydysgu site can congratulate Graham Attwell on his birthday. I hope there is no home-made rule that would prevent us from celebrating this day via his own website.  Cheers, Graham!

Years and more …

Why is there such a big gender difference in graduate employment

June 16th, 2017 by Graham Attwell

salaries grad

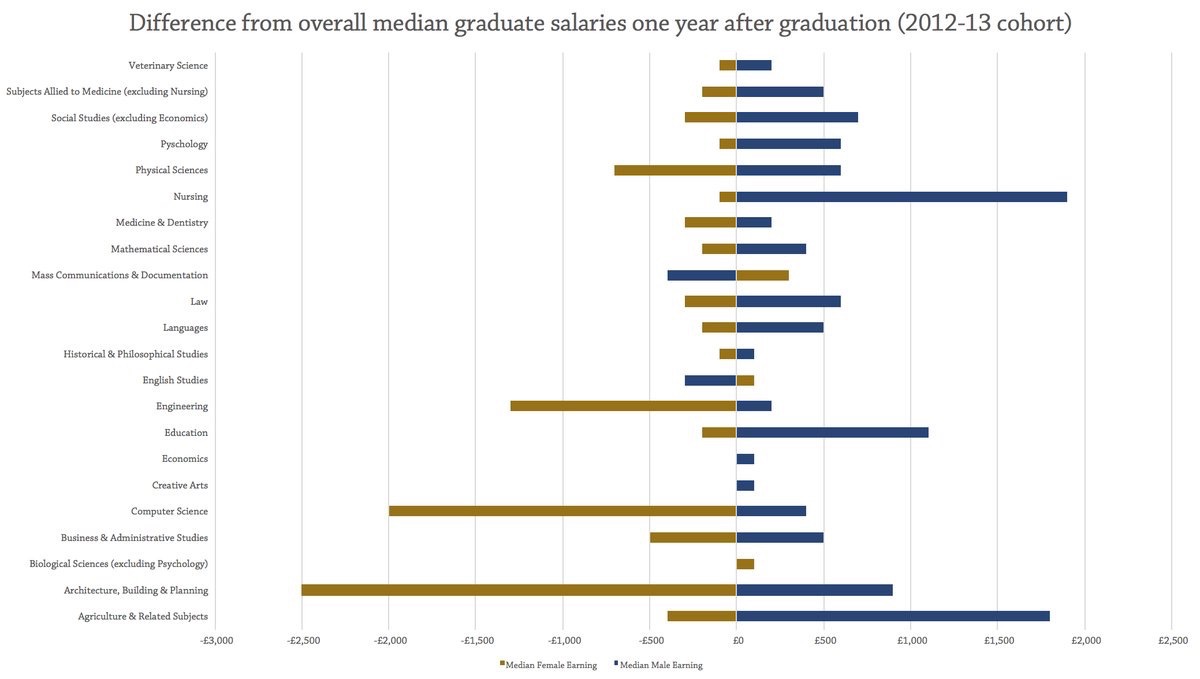
In our work on Labour Market Information Systems, we frequently talk about the differences between labour market information and labour market intelligence in terms of making sense and meanings from statistical data. The graph above is a case in point. It is one of the outcomes of a survey on Graduate Employment, undertaken by the UK Higher Education Statistics Agency (HESA).

Like many such studies, the data is not complete. Yet, looking at the pay by gender reveals what WONKHE call “a shocking picture of the extent of the pay gap even straight out of university, and how different subject areas result in a diverse range of pay differences.”

Understanding why there is such a gap is harder. One reason could be that even with equal pay legislation, employers simply prefer to employ male staff for higher paid and more senior jobs. Also, the graph shows the subject in which the students graduated, not the occupational area in which they are employed. Thus the strikingly higher pay for mean who undertook nursing degrees may be due to them gaining highly paid jobs outside nursing. Another probable factor in explaining some of the pay gap is that the figures include both full and part time workers. Nationally far more women are employed part time, than men. However, that explanation itself raises new questions.

The data from HESA shows the value of data and at the same time the limitations of just statistical information. The job now is to find out why there is such a stark gender pay gap and what can be done about it. Such ‘intelligence’ will require qualitative research to go beyond the bald figures.

Interpreting and presenting data

March 1st, 2017 by Graham Attwell

I have been working on the contents for week 4 of the free #EmployID MOOC on The Changing World of Work, taking place on the European EMMA platform and starting in late March. Week 4 is all about Labour Market Information – or as I prefer to call it, Labour Market Intelligence – and how we can use labour market data both for job seekers and young people choosing careers and by advisers and other professionals working in the careers and labour market domain.

One of the major challenges is how to represent data. This presentation, Data is beautiful: Techniques, tools and apps for sharing your results by Laura Ennis, provides some good practical advice on how to present data. It come from a talk she did at Leap Into Research 2017.

New Insights into UK society today from longitudinal research

December 8th, 2016 by Graham Attwell

Understanding Society has published its fifth annual report highlighting some of theinsights new topical policy-relevant research conducted recently using data from the annual survey which began in 2009 with around 100,000 individuals from 40,000 households.
To support the Insights 2016 launch, the team also published a topic guide on education. This guide explores the content available to analyse in Understanding Society, highlights the types of research questions which could be explored and what research has already been carried out.

Making sense of data about education and jobs

June 6th, 2016 by Graham Attwell

restorer
High or low skills? Graduate job or not?

For a number years now I have been working on projects developing the use of open data for careers counselling, advice and guidance. This work has been driven both by the increasing access to open data but also by the realisation of the importance of Labour Market Information (LMI) for those thinking about future education and / or jobs. And of course with high levels of job insecurity, such thinking becomes more urgent and in an unstable economy and labuor market, more tricky.

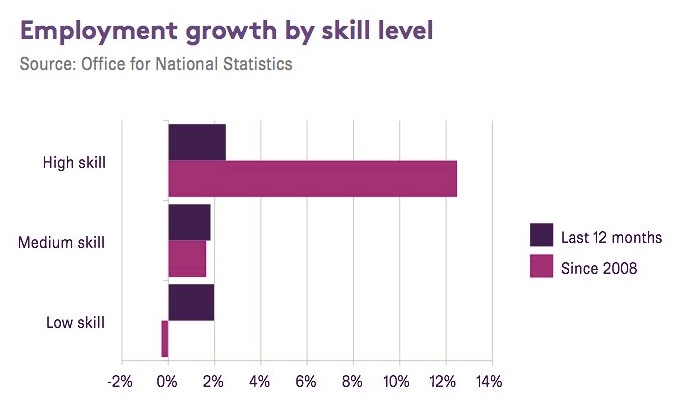
Yet even if we clean the data, add it to a database, provide and open API for access and develop tools for data visualisation, interpretation is still not easy. Here is one case, taken from this mornings Guardian newspaper.

employment graph


Although the article is using the chart to show the rapid growth in knowledge intense occupations, I am not sure it does. Assuming that these are percentage change based on the original job totals, it probably show growth in low skilled jobs is far outstripping high skilled work, especially in the last 12 months. And that is taking into account that (once again probably) most job loss due to technology is focused din low skilled areas – e.g the quoted 70,00 jobs lost in supermarket check outs due to automation.

I am also interested to see from wonkhe that “The Higher Education Statistics Agency (HESA) who have been running the Destination of Leavers Survey (DLHE) and its predecessors for 21 years, are now consulting widely on the future of assessing graduate outcomes.” For some time now there has been disquiet about the numbers of graduates working in ‘non graduate’ jobs. And that raises questions – just like the graph above focusing on high skills occupations – on just what a graduate job is. André Spicer, professor of organisational behaviour at the Cass Business School, City University London has cited “studies suggesting that the jobs which require degree-educated employees have peaked in 2000 and may be going down” and notes that many people apparently employed for their high-level specialist skills end up doing sales and marketing or fairly routine generalist work.

All this of course is highly subversive. Officially we are moving towards a high skilled economy needing more graduates and requiring higher level apprenticeships. My feeling in country slick Spain with high youth unemployment is what we need are apprenticeships in areas like construction and hospitality – both because they are sectors which can provide employment and also where higher skills are desperately needed to improve quality and productivity. Yet for governments there is an awful temptation to launch programmes in new ‘sexy’ areas  like games technologies despite the scarcity of jobs in these fields.

Tensions in Learning Analytics

May 27th, 2016 by Graham Attwell

The debate around Learning Analytics seems to be opening up. And although there is little sign of agreement over future directions, the terms of discussion seem both broader and more nuanced than previously. I think some of this is in response to the disillusionment of early researchers and adopters.

In yesterdays OLDaily, Stephen Downes pointed to an excellent article by Bodong Chen. Bodong points to the surge of interest in Learning Analytics but cautions that: “The surge of this nascent field rests on a promise–and also a premise–that digital traces of learning could be turned into actionable knowledge to promote learning and teaching.

He suggests that: “One approach to understanding learning analytics is to recognize what are not learning analytics” including academic analytics and educational data mining. Instead, he says “learning analytics is more directly concerned with teachers and learners by attending to micro-patterns of learning.”

Bodong draws attention to a tension between learning and analytics “as two pivotal concepts of the field” He points out that “learning analytics deals with educational phenomena at multiple levels”. As an example he says: “collaborative knowledge building as a group phenomenon depends on contributions from individuals, but cannot be reliably inferred from individual learning.”

Understanding and accepting that “the meaning of learning analytics as a term is plural and multifaceted” is an important basis for future research. Within the only just emerging field of workplace Learning Analytics, not only is there the issue of individual and collaborative learning and knowledge development but also issues around proxies for learning. Whilst performance in practice might be seen as a possible proxy, performance may also be seen to involve a wider range of factors, including the working environment, the division of work and opportunities for practice. And the already established field of Performance Analytics seems at considerable tension to learning.

Lack of proxies a problem for Workplace Learning Analytics

May 3rd, 2016 by Graham Attwell
I’ve been spending a lot of time thinking about Learning Analytics lately and this is the first of four or five short posts on the subject. Its all been kicked off by attending the Society of Learning Analytics pre conference workshops last week – LAK16 – in Edinburgh. Sadly I couldn’t afford the time and money to go to both the workshops and the full conference but many of the presentations and papers from the conference are already viable online.
My interest in Learning Analytics stems from the EmployID project which is aiming to support scalable and cost-effective facilitation of professional identity transformation in public employment services. And in our project application under the EU Research Framework (Horizon 2020) we said we would research and develop Learning Analytics services for staff in Public Employment Services. Easier said than done! An early literature review revealed that despite present high levels of interest (hype?) in Learning Analytics in formal education there has been very little research and development in Workplace Learning Analytics: therefore my excitement at a workshop on this subject at LAK16. But sadly despite the  conference selling out with 400 attendees, we only had four papers submitted for the workshop and just 11 attendees. What this did allow was a lot of in-depth discussion, which has left me plenty of issues to think about. And of course one of the issues we discussed was why there is apparently so little interest in Workplace Learning Analytics. It was pointed out that there have been a number of work oriented presentations in previous LAK conferences but these had remained isolated with no real follow up and with no overall community emerging.
There was also a general feeling that the Learning Analytics community was weak in terms of learning theory and pedagogy, both of which were censored central to Workplace Learning Analytics. But perhaps most importantly Learning Analytics approaches in schools and Higher Education lean heavily on proxies for learning, for instance examination results and grades. With the lack of such proxies for learning in the workplace, Learning Analytics has to focus on real learning – usually in the absence of a Learning Management System. And that is simply very hard to design and develop.Yet having said that, most if not all of us in the workshop were convinced that the real future of Learning Analytics in in the workplace, with a focus on understanding learning including informal learning and improving both learning and the environment in which it occurs.
We agreed on some modest next steps and will be launching a LinkedIn Group in the near future. In the meantime the papers and presentation from the workshop can be found at http://learning-layers.eu/laforwork/.

The challenge for Learning Analytics: Sense making

January 28th, 2016 by Graham Attwell

https://sylviamoessinger.files.wordpress.com/2012/06/learninganalytics_chalkboard.jpg

Image: Educause

Its true Twitter can be a distraction. But it is an unparalleled  resource for new ideas and learning about things you didn’t know you wanted to learn about. This morning my attention was drawn by a Tweet linking to a interview in Times Higher Education with Todd Rose entitled “taking on the ‘averagarians’.” Todd Rose believes that “more sophisticated examples of “averagarian” fallacies – making decisions about individuals on the basis of what an idealised average person would do – are causing havoc all round.” The article suggests that this applies to higher education giving the example that “Universities assume that an average student should learn a certain amount of information in a certain amount of time. Those who are much quicker than average on 95 per cent of their modules and slower than average on 5 per cent may struggle to get a degree.”

It seems to me that this is one of the problems with Data Analytics. It may or may not matter that an individual is doing better or worse than the average in a class or that they spend more or less time reading or even worse logged on to the campus VLE. Its not that this data isn’t potentially useful but it is what sense to make of it. I’m currently editing a paper for submission to the workshop on Learning Analytics for Workplace and Professional Learning (LA for Work) at Learning Analytics and Knowledge Conference (LAK 2016) in April (I will post a copy of the paper here on Sunday). And my colleague Andreas Schmidt has contributed what I think is an important paragraph:

Supporting the learning of individuals with learning analytics is not just as designers of learning solutions how to present dashboards, visualizations and other forms of data representation. The biggest challenge of workplace learning analytics (but also learning analytics in general) is to support learners in making sense of the data analysis:

  • What does an indicator or a visualization tell about how to improve learning?
  • What are the limitations of such indicators?
  • How can we move more towards evidence-based interventions

And this is not just a individual task; it requires collaborative reflection and learning processes. The knowledge of how to use learning analytics results for improving learning also needs to evolve through a knowledge maturing process. This corresponds to Argyris & Schön’s double loop learning. Otherwise, if learning analytics is perceived as a top-down approach pushed towards the learner, it will suffer from the same problems as performance management. These pre-defined indicators (through their selection, computation, and visualization) implement a certain preconception which is not evaluated on a continuous basis by those involved in the process. Misinterpretations and a misled confidence in numbers can disempower learners and lead to an overall rejection of analytics-driven approaches.

Predicting mid and long term skills needs in the UK

June 24th, 2015 by Graham Attwell

Labour Market Information (LMI)  is not perhaps the most popular subject to talk about. But with the advent of open and linked data, LMI  is increasingly being open up to wider audiences and has considerable potential for helping people choose and plan future careers and plan education programmes, as well as for use in research, exploring future skills needs and for social and economic planning.

This is a video version of a presentation by Graham Attwell at the Slovenian ZRSZ Analytical Office conference on “Short-term Skills Anticipations and Mismatch in the Labour Market. Graham Attwell examines ongoing work on mid and long term skills anticipation in the UK. He will bases on work being undertaken by the UK Commission for Employment and Skills and the European EmployID project looking, in the mid term, at future skills needs and in the longer term at the future of work. He explains the motivation for undertaking these studies and their potential uses. He also explains briefly the data sources and statistical background and barriers to the wok on skills projections, whilst emphasising that they are not the only possible futures and can best serve as a a benchmark for debate and reflection that can be used to inform policy development and other choices and decisions. He goes on to look at how open and linked data is opening up more academic research to wider user groups, and presents the work of the UKCES LMI for All project, which has developed an open API allowing the development of applications for different user groups concerned with future jobs and future skills. Finally he briefly discusses the policy implications of this work and the choices and influence of policymakers in influencing different futures.


  • Search Pontydysgu.org

    Social Media


    News Bites

    Cyborg patented?

    Forbes reports that Microsoft has obtained a patent for a “conversational chatbot of a specific person” created from images, recordings, participation in social networks, emails, letters, etc., coupled with the possible generation of a 2D or 3D model of the person.


    Racial bias in algorithms

    From the UK Open Data Institute’s Week in Data newsletter

    This week, Twitter apologised for racial bias within its image-cropping algorithm. The feature is designed to automatically crop images to highlight focal points – including faces. But, Twitter users discovered that, in practice, white faces were focused on, and black faces were cropped out. And, Twitter isn’t the only platform struggling with its algorithm – YouTube has also announced plans to bring back higher levels of human moderation for removing content, after its AI-centred approach resulted in over-censorship, with videos being removed at far higher rates than with human moderators.


    Gap between rich and poor university students widest for 12 years

    Via The Canary.

    The gap between poor students and their more affluent peers attending university has widened to its largest point for 12 years, according to data published by the Department for Education (DfE).

    Better-off pupils are significantly more likely to go to university than their more disadvantaged peers. And the gap between the two groups – 18.8 percentage points – is the widest it’s been since 2006/07.

    The latest statistics show that 26.3% of pupils eligible for FSMs went on to university in 2018/19, compared with 45.1% of those who did not receive free meals. Only 12.7% of white British males who were eligible for FSMs went to university by the age of 19. The progression rate has fallen slightly for the first time since 2011/12, according to the DfE analysis.


    Quality Training

    From Raconteur. A recent report by global learning consultancy Kineo examined the learning intentions of 8,000 employees across 13 different industries. It found a huge gap between the quality of training offered and the needs of employees. Of those surveyed, 85 per cent said they , with only 16 per cent of employees finding the learning programmes offered by their employers effective.


    Other Pontydysgu Spaces

    • Pontydysgu on the Web

      pbwiki
      Our Wikispace for teaching and learning
      Sounds of the Bazaar Radio LIVE
      Join our Sounds of the Bazaar Facebook goup. Just click on the logo above.

      We will be at Online Educa Berlin 2015. See the info above. The stream URL to play in your application is Stream URL or go to our new stream webpage here SoB Stream Page.

  • Twitter

  • Recent Posts

  • Archives

  • Meta

  • Categories