Archive for the ‘Data’ Category

Using Labour Market Information for Career Development in the Changing World of Work

February 18th, 2021 by Graham Attwell

I was invited to make a presentation earlier this week to the European Union Horizon 2020 HECAT project exploring the use of algorithms within public employment systems. Waterford (Ireland) Institute of Technology is coordinating the project and according to the WaterfordLive web site “HECAT is a sociologically and anthropologically led project to make data trapped in public employment systems (PES) and national statistical offices available to unemployed people and those trying to help them to improve their personal decision-making and visionary future.” Dr Griffin from the Institute said: “Everyone is concerned or should be worried about how algorithms and big data is being used in the labour market, we cannot put the technology genie back in the bottle, rather we need to figure out how to make the output from these novel technologies ethical, fair and transparent. We need to crack them open sociologically and anthropologically so that traditional researchers can fully understand how they operate and communicate that to the public.”

Anyway here are my slides.

The State of Data 2020

September 28th, 2020 by Graham Attwell
social media, media, board

geralt (CC0), Pixabay

One result of the Covid 19 pandemic is it seems like every day now there are free events. This week is no exception and this conference looks great. I can’t make all of it – too many other meetings but I hope to dip in and out (another advantage of online conferences).

On Tuesday September 29 and Wednesday September 30, 2020 the State of Data event will bring together researchers, practitioners, and anyone with an interest in why data matters in state education in England.

You can choose to register if you want to use the calendar functionality and accept the privacy terms of Hopin, to see the events as they come live. Or simply watch in your own time without registering, after the event, via the links below.

Between algorithmic fairness in exam moderation and the rush to remote learning in response to the COVID-19 pandemic, 2020 has raised questions on children’s digital rights like never before in England’s education system. defenddigitalme is a call to action.

The conference has a vision of a rights’ respecting environment in the state education sector in England. We want to help build the future of safe, fair and transparent use of data across the public sector. This event will coincide with the launch of their report The State of Data 2020: mapping the data landscape in England’s state education system.

There is a range of content and discussion for practitioners in education and data protection, senior leadership and DPOs, local authority staff, developers, vendors and the edTech community, academics and activists, policy advisors and politicians —they say they want to create opportunities for questions and answers across silos. As the conference web site says: “We need to start a conversation about changing policy and practice when it comes to children’s data rights in education.”

Racial bias in algorithms

September 25th, 2020 by Graham Attwell

From the UK Open Data Institute’s Week in Data newsletter

This week, Twitter apologised for racial bias within its image-cropping algorithm. The feature is designed to automatically crop images to highlight focal points – including faces. But, Twitter users discovered that, in practice, white faces were focused on, and black faces were cropped out. And, Twitter isn’t the only platform struggling with its algorithm – YouTube has also announced plans to bring back higher levels of human moderation for removing content, after its AI-centred approach resulted in over-censorship, with videos being removed at far higher rates than with human moderators.

More ways of understanding the Labour Market

September 15th, 2020 by Graham Attwell
architecture, skyscraper, glass facades

MichaelGaida (CC0), Pixabay

In most countries we have traditionally relied on official labour market agencies for data for understanding the labour market. From an education and training standpoint, that data has not always been ideal – given the main users are economic planners and policy makers – and the data collected is often difficult to interpret from the viewpoint of careers guidance or education and training provision.

One of the main limitations of national data from official agencies is that the sample is often too small to draw conclusions at a local – or sometimes even regional – level. Yet opportunities for employment vary greatly by region, town and city. In recent years there has been a growth in popularity of scraped data, using big data technologies and techniques to scrape and analyse online job vacancies. This work has mainly been undertaken by US based private sector companies although the EU CEDEFOP agency has also developed a multi national project scraping and analysing data. The job advert data is not better or worse than tradition labour market data. It is another source of data providing another angle from how to understand what is going on. Pontydysgu is part of a consortium in the final of the  UK Nesta CareerTech Challenge prize. Our main word is developing a Chatbot for providing information for people whose jobs are at risk as a result of automation and AI. Of course that includes labour market information as well as possibly scraped data and we have been thinking about other sources of data, not traditionally seen as labour market information.

One organisation which is accessing, visualising and publishing near real time data is the Centre for Cities in the UK. It says its mission is to help the UK’s largest cities and towns realise their economic potential.

We produce rigorous, data-driven research and policy ideas to help cities, large towns and Government address the challenges and opportunities they face – from boosting productivity and wages to preparing for Brexit and the changing world of work.

We also work closely with urban leaders, Whitehall and business to ensure our work is relevant, accessible and of practical use to cities, large towns and policy makers

Since the start of the Covid 19 pandemic the Centre for Cities has been tracking the impact on the labour market. They say:

Luton, Slough and Blackpool have seen the largest increases in unemployment since lockdown began. Meanwhile, cities and towns in predominantly in southern England and The Midlands have seen smaller increases in unemployment. Cambridge, Oxford, Reading, Aberdeen and York have seen some of the smallest increases in unemployment since March.

As of mid-June Crawley, Burnley, Sunderland and Slough have the largest shares of people being paid by the Government’s furlough scheme.

In the medium term, as many as one in five jobs in cities and large towns could be at risk of redundancy or furloughing, and those reliant on the aviation industry, such as Crawley and Derby, are likely to be hardest hit. These areas are also the places most likely to be worst affected if the Job Retention Scheme is withdrawn too soon.

One interesting tool is the high street recovery tracker. This compares the economic performance of city centers since the outset of the Covid 19 crisis. At present they say footfall in the UKs 63 biggest cities has increased by seven percentage points in August and now reaches 63 per cent of pre-lockdown levels.

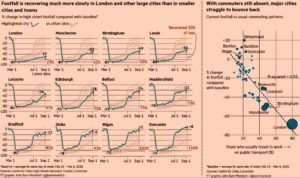
However, this figure hides great geographic differences: in 14 city centres, footfall in August exceeded pre-lockdown levels; particularly in seaside towns and smaller cities. At the other end of the spectrum, large cities like Manchester and Birmingham have barely recovered half of their pre-lockdown levels of activity.

Instead of relying on traditional surveys for this data, which would take some time to process and analyse, the recovery tracker is based on mobile phone analysis. Another potentially interesting non traditional source of data for understanding labour markets may be travel data, although that data is heavily disrupted by Covid 19. But that disruption in itself may be interesting, given the likelihood that those cities with continuing low travel to work numbers are likely to have a higher percentage of office based work, and possibly a focus on non customer based finance and administration employment. Conversely those cities where travel to work volumes are approaching near normal are probably more concentrated on retail and manufacturing industry.

All in all, there is a lot going on in novel data sources for labour market information. And of course we are also looking at how such data might be accessed:hence our Chatbot project.

SMEs are not the same as large firms

December 18th, 2019 by Graham Attwell

Much of my work at the moment is focused in two different areas – the training and professional development of teachers and trainers for the use of technology for teaching and learning and the use and understanding of labour market data for careers counseling, guidance and advice. However as data increasingly enters the world of education, the two areas are beginning to overlap.

This morning I received an email from the European Network on Regional Labour Market Monitoring. Although the title may seem a little obscure, the network, which has been active over some time, organises serious research at a pan European level. Each year it selects a theme for research, publications and for its annual conference. Over the last year it has focused on informal employment. Next year’s theme is Small and Medium Enterprises (SMEs) which they point out can be viewed as perhaps the most vibrant and innovative area of the European economy. However, when it comes to researching and understanding SMEs it is not so easy

A number of European or national statistics exist to analyse SMEs’ but they generally use the same categories as for large firms and are, in general, constructed from a large firm perspective or in any case not from a framework based on SME characteristics. Many academic papers focusing on SMEs show that they cannot fully be understood using the same categories as with large firms. The general idea is that firstly, SMEs are same as large ones, just smaller. Secondly, the assumption that they will grow up to become Midcaps, then large firms, is incorrect. Torres and Julien (2005) start their article explaining that “Most, if not all, researchers in small business have accepted the idea that small business is specific (the preponderant role of the owner-manager, low level of functional breakdown, intuitive strategy, etc.)”. A 2019 French publication directed by Bentabet and Gadille tackles the issue of SMEs focussing on their specific “social worlds”, their “action models and logics”, while elsewhere the influences of institutional logics and multi-rationalities of SMEs have been considered. The entry of social worlds highlights the great diversity of micro-enterprises and SMEs, which often makes it difficult to analyse them. As a counterpoint, specific knowledge of these companies is required because they are at the heart of the debates on flexibility, labour market dynamics, skilled labour shortage and disruptions in the vocational training system.

SMEs will be the focus for the next Annual Meeting of the Regional Labour Market Monitoring to be held in September 2020 in Sardinia

Understanding the gender pay gap

December 5th, 2019 by Graham Attwell

We have written before about the gender pay gap in the UK. According to the Office for National Statistics the average hourly (gross, excluding overtime) gender pay gap in the UK for all employees fell from 17.8 per cent in 2018 to 17.3 per cent in 2019. However, nee research has revealed cross-national gaps vary from as much as -5 per cent in Wigan to 32 per cent in Slough suggesting that only focusing on a national perspective might be overly simplistic.

The Centre for Cities has found that 7 of the 10 cities with the highest gender pay gap are located either in the South East or East of England. They say that “as cities in these regions tend to perform economically better than cities in the North of England, economic performance seems to influence the gender pay gap in cities. In general, cities with higher average weekly earnings (e.g. Cambridge, London, Reading, Crawley, Slough) tend to have a higher gender pay gap.”

Another factor the Centre for Cities things is driving higher gender pay gaps in the south of England is the bigger difference between men and women holding a managerial position. While 5.2 of men and 3.2 per cent of women in the north east hold such a position, 8.1 per cent of managers in the south east are men while only 4.4 per cent are women (data is not available below regional level).”

Six out of the ten cities with the smallest gender pay gap are located in the North of England: Wigan, Burnley, Warrington, Sunderland, Blackburn and Middlesbrough. These cities have weaker economies and lower rates of employment

The Centre for Cities has looked at the industrial composition of the labour market in Warrington and Wigan, finding that both cities have a higher share of jobs in education, human and health activities and social work than cities with higher gender pay gaps such as Slough and Crawley.

The composition of sectors in and around cities is seen as important and since women are more likely to be employed in the public sector, for instance, as teachers, social workers and nurses, the gender pay gap tends to be lower in cities with a higher proportion of public sector jobs such as in Middlesbrough, Blackburn, Swansea and Glasgow.

Travel to university time a factor in student performance

August 14th, 2019 by Graham Attwell

My summer morning’s work is settling into a routine. First I spend about half an hour learning Spanish on DuoLingo. Then I read the morning newsletters – OLDaily, WONKHE, The Canary and Times Higher Education (THE).

THE is probably the most boring of them. But this morning they led on an interesting and important research report. In an article entitled ‘Long commutes make students more likely to drop out’, Ana McKie says:

Students who have long commutes to their university may be more likely to drop out of their degrees, a study has found.

Researchers who examined undergraduate travel time and progression rates at six London universities found that duration of commute was a significant predictor of continuation at three institutions, even after other factors such as subject choice and entry qualifications were taken into account.

THE reports that the research., commissioned by London Higher, which represents universities in the city found that “at the six institutions in the study, many students had travel times of between 10 and 20 minutes, while many others traveled for between 40 and 90 minutes. Median travel times varied between 40 and 60 minutes.”

At one university, every additional 10 minutes of commuting reduced the likelihood of progression beyond end-of-first-year assessments by 1.5 per cent. At another, the prospect of continuation declined by 0.63 per cent with each additional 10 minutes of travel.

At yet another institution, a one-minute increase in commute was associated with a 0.6 per cent reduction in the chances of a student’s continuing, although at this university it was only journeys of more than 55 minutes that were particularly problematic for younger students, and this might reflect the area these students were traveling from.

I think there are a number of implications from this study. It is highly probable that those students traveling the longest distance are either living with their parents or cannot afford the increasingly expensive accommodation in central London. Thus this is effectively a barrier to less well off students. But it is also worth noting that much work in Learning Analytics has been focused on predicting students likely to drop out. Most reports suggest it is failing to complete or to success in initial assignments that is the most reliable predicate. Yet it may be that Learning Analytics needs to take a wider look at the social, cultural, environmental and financial context of student study with a view to providing more practical support for students.

I work on the LMI for All project which provides an API and open data for Labour Market Information for mainly use in careers counseling advice and guidance and to help young people choose their future carrers or education. We already provide data on travel to work distances, based on the 2010 UK census. But I am wondering if we should also provide data on housing costs,possibly on a zonal basis around universities (although I am not sure if their is reliable data). If distances (and time) traveling to college is so important in student attainment this may be a factor students need to include in their choice of institution and course.


Learning Analytics Cymru

June 25th, 2019 by Graham Attwell

Jisc report that “Learning Analytics Cymru is generating interest across the world.” The service, which has every higher education institution in Wales signed up and is supported by the Welsh Government, is the focus of a new article for US edtech organisation Educase.

In the piece Jisc consultant Niall Sclater’s  discusses the Learning Analytics Cymru model and how it provides a blueprint for delivering such services on a national scale.

By pooling resources, institutions are benefiting from opportunities to share experiences and learn collaboratively in the emerging field of learning analytics.

Cite your data

June 17th, 2019 by Graham Attwell


Neat short video from the UK data service about why and how you should cite data. Citations are always a bit of a pain, but the video shows how using the DOI make slife easy (and it expelains what the DOI is!

Is manufacturing finished in the UK?

June 12th, 2019 by Graham Attwell

The Guardian newspaper highlights a report by Cambridge University for the Department for Business, Energy and Industrial Strategy (BEIS), showing that Britain’s manufacturing sector is much larger than official figures suggest.

The report argues that official statistics, which estimate that manufacturing output accounts for 9% of national income, are based on “outdated and inaccurate methods of counting” and the figure is much higher.

The report avoids putting a fresh figure on the proportion of GDP accounted for by the sector, but one of its authors said it was nearer 15% once activities tied to the sale of UK-made products, including engineering support and contracted services, were included.

“It is essential that policymakers have accurate information on the size of manufacturing sectors in order to develop an internationally competitive industrial strategy,” said Eoin O’Sullivan, one of the report’s authors.

“In particular, policymakers need to be able to measure manufacturing in a way that better reflects how firms actually organise themselves into value networks.”

While the Guardian news spin on the report focuses on the threat to the manufacturing by tariffs on exports resulting from a no deal Brexit, the report has wider implications. Manufacturing has long been seen as in decline and is accordingly unattractive as a careers option when compared to the growing service sector. Yet the report shows the continuing importance of occupations like engineering.

  • Search Pontydysgu.org

    Social Media


    News Bites

    Cyborg patented?

    Forbes reports that Microsoft has obtained a patent for a “conversational chatbot of a specific person” created from images, recordings, participation in social networks, emails, letters, etc., coupled with the possible generation of a 2D or 3D model of the person.


    Racial bias in algorithms

    From the UK Open Data Institute’s Week in Data newsletter

    This week, Twitter apologised for racial bias within its image-cropping algorithm. The feature is designed to automatically crop images to highlight focal points – including faces. But, Twitter users discovered that, in practice, white faces were focused on, and black faces were cropped out. And, Twitter isn’t the only platform struggling with its algorithm – YouTube has also announced plans to bring back higher levels of human moderation for removing content, after its AI-centred approach resulted in over-censorship, with videos being removed at far higher rates than with human moderators.


    Gap between rich and poor university students widest for 12 years

    Via The Canary.

    The gap between poor students and their more affluent peers attending university has widened to its largest point for 12 years, according to data published by the Department for Education (DfE).

    Better-off pupils are significantly more likely to go to university than their more disadvantaged peers. And the gap between the two groups – 18.8 percentage points – is the widest it’s been since 2006/07.

    The latest statistics show that 26.3% of pupils eligible for FSMs went on to university in 2018/19, compared with 45.1% of those who did not receive free meals. Only 12.7% of white British males who were eligible for FSMs went to university by the age of 19. The progression rate has fallen slightly for the first time since 2011/12, according to the DfE analysis.


    Quality Training

    From Raconteur. A recent report by global learning consultancy Kineo examined the learning intentions of 8,000 employees across 13 different industries. It found a huge gap between the quality of training offered and the needs of employees. Of those surveyed, 85 per cent said they , with only 16 per cent of employees finding the learning programmes offered by their employers effective.


    Other Pontydysgu Spaces

    • Pontydysgu on the Web

      pbwiki
      Our Wikispace for teaching and learning
      Sounds of the Bazaar Radio LIVE
      Join our Sounds of the Bazaar Facebook goup. Just click on the logo above.

      We will be at Online Educa Berlin 2015. See the info above. The stream URL to play in your application is Stream URL or go to our new stream webpage here SoB Stream Page.

  • Twitter

  • Recent Posts

  • Archives

  • Meta

  • Categories