Archive for the ‘Data’ Category

Workplace Learning Analytics

June 16th, 2015 by Graham Attwell

EmployID is an EU-funded, four-year project which aims to support Public Employment Services staff to develop competences that address the need for integration and activation of job seekers in fast changing labour markets. According to the official flyer: “It builds upon career adaptability and resilience in practice, including quality and evidence- based frameworks for enhanced individual and organisational learning. It also supports the learning process of PES practitioners and managers in their professional identity development by supporting the efficient use of technologies to provide advanced coaching, reflection, networking and learning support services as well as MOOCs.”

One of the aims for research and development is to introduce the use of Learning Analytics within Public Employment Services. Although there is great interest in Learning Analytics by L and D staff, there are few examples of how Learning Analytics might be implanted in the workplace. Indeed looking at research reported by the Society for Learning Analytics Research reveals a paucity of attention to the workplace as a learning venue.

In this video, Graham Attwell proposes an approach to Workplace Learning Analytics based on the Social Learning Platform model (see diagram) adopted by the Employ ID project. He argues that rather merely fathering together possible data and then trying to work out what to do with it, data needs to be sought which can answer well designed research questions aiming to improve the quality of learning and the learning environment. socialllearningplatform
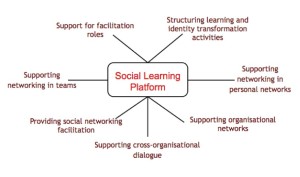
 

In the case of EmployID these questions could be linked to the six different foci of the Social Learning Platform, namely:

  • Support for facilitation roles
  • Structuring identity transformation activities
  • Supporting networking in personal networks
  • Supporting organisational networks
  • Supporting cross organisational dialogue
  • Providing social networking facilitation
  • Supporting networking in teams

For some of these activities we already have collected some “docital traces” for instance data on facilitation roles through within a pilot MOOC. In other cases we will have to think how best to develop tools and approaches to data gathering, both qualitative and quantitative.

The video has been produced to coincide with the launch of The Learning Analytics Summer Institute, a strategic event, co-organized by SoLAR and host institutions and by a global network of LASI-Locals who are running their own institutes.

Workplace Learning and Learning Analytics

April 15th, 2015 by Graham Attwell

I have been looking hard at Learning Analytics in the last month. In particular, as part of the European EmployID project application, as a bit of a not really thought through objective, we said we would experiment with the use of Learning Analytics in European Public Employment Services. this raises a series of issues which I will come back to in future ports. It seems to me that whilst there is much talk around the potential of  Learning Analytics in the workplace, there is very limited research and actual applications.

One of the reasons for this is that so much learning in the workplace in informal. As Boud and Hager (2012) say:

learning is a normal part of working, and indeed most other social activities. It occurs through practice in work settings from addressing the challenges and problems that arise. Most learning takes place not through formalized activities, but through the exigencies of practice with peers and others, drawing on expertise that is accessed in response to need. Problem-solving in which participants tackle challenges which progressively extend their existing capabilities and learn with and from each other appears to be common and frequent form of naturalistic development.

I would also add that much workplace learning is also driven through personal interest – a fact that is largely ignored and which has considerable economic implications in terms of workplace competence development. Although we can dream of a world where water cooler conversations are recorded by smart devices and sensors and added to other traces of digital activity, I am not sure this is a desirable outcome. So we have a challenge. most (university and formal education based) learning analytics focus on analysing digital interactions in, for example, a VLE. How can we sensibly and ethically extend data capture and analysis to informal workplace learning?

Learning Analytics

March 23rd, 2015 by Graham Attwell

Intro to learning analytics universities scotland_dec2014_smn from Sheila MacNeill

I am getting increasingly interested in Learning Analytics. But the more I think about it, the more questions I have. I am impressed with the Jisc project on Learning Analytics on which this presentation is based.

Open Data App Challenge

November 12th, 2014 by Graham Attwell

Pontydysgu are working with the UK Data Service to open up three datasets under an open data license and then run an Open Data App Challenge during late spring/summer 2015. This a ESRC (Economic Social Research Council) innovation fund project.

Last Friday I went to a UK Data Service panel session and networking event at the Open Data Institute in London talking about our work and the issues around opening up data under an open data license. The audience was mostly App Challenge members and data owners. This event was held as part of the ESRC Festival of Social Science Week and we invited along some other experts as well.

The session included Ralph Cochrane (App Challenge), Louise Corti (UK Data Service), Jonathan Raper (Transport API), Olivia Ely (UKCES), Moeen Khwaja (Thingful)

Ralph has wriiten about the event on the Open Data Challenge web site. “The UKCES and their LMI for All programme have one of the best developed government APIs for accessing open data around jobs, careers and employment statistics)” he says.

“Transport API is the leading provider of open transport data in the UK. Anyone can sign up to their API on a pay per use basis. They have data relating to trains, roads, construction and even Heathrow airport.

Thingful is a discovery or search engine for the Internet of Things. There are many sensors and devices out there that publish their state and if you can link these as a data stream they can enrich many other datasources and services. For example, there are weather sensors on top of most high rise buildings in London. Could they be connected to the Met Office to help with weather based planning?

Louise is the project leader for the Open Data App Challenge project and is based at the University of Essex campus in Colchester.

Ralph Cochrane moderated this panel session and is the founder of App Challenge. He’s a crowdsourcing expert and runs the developer community day-to-day working with many of the world’s leading companies.”

Marx, use value, exchange value and social networks

October 13th, 2014 by Graham Attwell

I have to admit I am not a great fan of lectures on line. there seems far to little human interaction and the slick production of things like the TED talks has got both ‘samey’ and somewhat tedious. But I loved this lecture by David Harvey on Karl Marx delivered in Amsterdam with no slides and no notes! As the blurb says “David Harvey is a Distinguished Professor of Anthropology & Geography at the Graduate Center of the City University of New York (CUNY), and the author of numerous books. He has been teaching Karl Marx’s Capital for over 40 years.”

David Harvey does not shy away from the politics of Karl Marx. But his focus is on Marx’s writings and ideas as a tool for social science and analysis. For those of you without the time, interest or patience to listen to the whole video the particular bits I found interesting include his ideas around rational consumption (about 30 minutes in), the idea of accumulation by dispossession (some 38 minutes in), the idea of management of the ommons important (after about 47 minutes) and contradictions over the role of the state (towards the end of the lecture and before the discussion).

Harvey talks a lot about contradictions – the biggest being the contradiction between use value and exchange value. As Wikipedia explains: “In Marx’s critique of political economy, any product has a labor-value and a use-value, and if it is traded as a commodity in markets, it additionally has an exchange value, most often expressed as a money-price. Marx acknowledges that commodities being traded also have a general utility, implied by the fact that people want them, but he argues that this by itself tells us nothing about the specific character of the economy in which they are produced and sold.”

Much of David Harvey;s work has been in the area of urban development and housing and he explains how this contradiction applies there and its implications. But it may also be a useful explanation of understanding what is happening with social networks. Social networks have a use value for us all in allowing us to stay in touch with friends, develop personal learning networks, learn about new ideas or just letting off steam to anyone who will listen. OK – the exchange value is not expressed as a money price. But most people now realise that social networking applications are seldom free. Instead of paying money we give our data away for them to use. And in turn they use this data to try to extract money from us through buying commodities. This is all fine as long as the use value exceeds the exchange value. But as social network providers try to monetise their products they are constantly upping the ante in terms of exchange value. In other words we are increasingly being required to sign over our data as well as our privacy in order to use their applications.

Alternatively social networks are trying to push ever more commodities at us. An article in the Gaurdian newspaper yesterday over Twitters attempts to build a business model noted: “Chief executive Dick Costolo has talked longingly about growing, and eventually making money from, the huge number of people who view tweets without signing up. This is fine on YouTube, where most of us watch the content without producing it and only sigh a little as we’re forced to watch ads when we do so. In contrast, sponsored tweets are a bit like being asked to pay for gossip from your colleague over the coffee machine.”

All this means more and more people are questioning whether the use value of Facebook and Twitter is worth the exchange value.

And such contradictions are hard to resolve!

Opening up data and research

September 19th, 2014 by Graham Attwell

Much of the focus of the open education movement has been on Open Educvational Resources and MOOCs. But just as important, in my humble opinion, is opening up research to a wider public. This is not only confined to opening up access to the results of research but allowing access to a wider audience than acandmicsx to raw research data. And there are a growing number of web sites that are doing this. One of the sites i am loving is the Understanding Society website based on the UK Households survey and run by designed and managed by a team of longitudinal survey experts at the Institute for Social and Economic Research (ISER), at the University of Essex.

Understanding Society, they say, “is a unique and valuable academic study that captures important information every year about the social and economic circumstances and attitudes of people living in 40,000 UK households.

It also collects additional health information from around 20,000 of the people who take part.

Information from the longitudinal survey is primarily used by academics, researchers and policy makers in their work, but the findings are of interest to a much wider group of people including those working in the third sector, health practitioners, business, the media and the general public.”

One study based on the survey and recently posted on the Understanding Society web site  looks at Gender differences in educational aspirations and attitudes land examined the ambitions and approaches to study of 11-15 year olds participating in the British Household Panel Survey.

The sudy says that “while girls have more positive aspirations and attitudes than boys, the impacts of gender on children’s attitudes and aspirations vary significantly with parental education level, parental attitudes to education, child’s age and the indirect cost of education.

Boys are more responsive than girls to positive parental characteristics, while educational attitudes and aspirations of boys deteriorate at a younger age than those of girls.

Girls also acknowleged the impact of the recession and increased youth unemployment by working harder. Boys however appear unresponsive to the business cycle. This might reflect misplaced confidence where they believe they will be able to find a job independently from the economic climate. Policies targeting boys with more information on the benefits from investing in education will increase their awareness about the consequences of an unfavourable youth labour market, which may improve their educational attitudes and aspirations and consequently their educational attainment.”

I’m not sure what is make of all this. But I wonder if there is any comparative data from other countries? No doubt it would be a chnallenge to norm such data, but it could greatly help in understanding why boys in the UK are underperforming. If you know of such data plese just add a comment or drop me an email.

The challenges of open data: emerging technology to support learner journeys

September 16th, 2014 by Graham Attwell

As promised, a post on our stand and presentation at Alt-C on the LMIforAll Labour Market Data project, sponsored by UKCES. Working together with the Institute for Employment Research at Warwick University and Raycom, we have developed a database and APi providing access to a range of data about a wide variety of different occupations in the UK including data about:

  • Pay
  • Gender
  • Numbers employed
  • Future employment projections
  • Occupational profiles
  • Skills and competences
  • Job vacancies
  • University destinations

The API is self documenting and is available free of charge to both for profit and not for profit organisatio0ns and developers. Working with Loud Source we have run a competition for Apps built on the API and together with Rewired State we have organised a series of Hack Days and Mod Days. We are currently redesigning the website to provide better access to the data and to the different applications that have been built to date.

One strange thing that took people visiting our stand some time to understand was that we were not selling anything (I think ours and Jisc were the only non commercial stands).  The second thing was that we were not trying to ‘sell’ them a shiny out of teh box project. To get added value from our database and API requires some thought and development effort on the part of organisations wanting to use the data. We provide the tools, they provide the effort to use them. But when people got that concept they were enthusiastic. And most interestingly they were coming up with completely new ideas for where the data might be valuable. As you can see in our presentation above, we have largely focused on the use of LMIforAll for careers planning. University and Further Education researchers and developers saw big potential using the API as a planning too for future courses and curriculum. Others saw it as a valuable resource for measuring employability, a big agenda point for many UK institutions. It was also suggested to us that the labour market data could be mashed together with data derived from learning analytics, providing possibly a more learner centred approach to analytics than has previously been deployed.

If you are interested in any of these ideas have a play on the LMIforAll web site. And feel free to get in touch if you have any questions.


CareerHack competition reeps rich harvest

March 31st, 2014 by Graham Attwell

First the official stuff (from the press release).

“Talented UK students have won three out of four prizes in a worldwide competition to create a new app to help people develop their career.

The CareerHack open data contest was launched in November last year by the UK Commission for Employment and Skills (UKCES), and asked developers around the globe to build an app based on the UK Commission’s “LMI for All” open data, which contains information on the UK labour market, including employment, skills and future job market predictions.

First prize winner for the competition was Tomasz Florczak from Logtomobile in Poland, who won £10,000 for his innovative Career Advisor app, while 16-year-old school student Harry Jones, from Bath, took home a £5,000 prize for his Job Happy entry.


The contest also had a special prize specifically for entrants aged 16-24 in Further Education. In this category 22-year-old IT apprentice Phillip Hardwick won the £5,000 prize for his entry, Career Path. And judges were so impressed with the quality of entrants from the category that they introduced an additional runner-up prize of £2,500, which went to a team effort from students at Barking and Dagenham College in London.

Competition judge Dr Deirdre Hughes OBE, Chair of National Careers Council and a Commissioner for UKCES, said:

“As judges we were all highly impressed at the outstanding contributions made by our winners, and of the talent and ability being displayed by the next generation of up-and-coming developers and programmers.

“The quality of the submissions was so high we felt the need to introduce an additional prize, but all those that entered should be extremely proud of their efforts.”

The judging panel was made up of technology experts from Google, Ubuntu and HP, alongside representatives from the UK Commission and John Lewis. Judges made their decision based on how innovative the entry was, how viable it was as a working app, the potential it had for making an impact on society and the overall quality of the packaged app.

CareerHack judge Matt Brocklehurst, Product Marketing Manager at Google UK said:

“At Google we’re well aware of the importance of making data open and encouraging young, creative talent. CareerHack was a fantastic example of this and we were very impressed by the high standard of entries from everyone who entered – the fact that three of the four winners are young people at the start of their careers is fantastic news.  We hope these prizes will enable them to get a head start down whichever career path they choose to follow.”

Fellow CareerHack judge Cristian Parrino, Vice President of Mobile and Online Services at Ubuntu, added:

“The CareerHack competition demonstrated how an set of open data can be used to cater to the needs of people at different stages of their career paths. It was wonderful to see the different flavours of high quality applications and services built on UKCES’s data.”

LMI for All has been developed by the UK Commission for Employment and Skills, working with a consortium led by the Institute for Employment Research at Warwick University and including Pontydysgu, RayCom and Rewired State.”

Pontydysgu’s bit in all this is managing the technical side. I have to say I was a bit sceptical of producing an APi and then opening it up and encouraging contributions through a competition, but having looked at the videos I am gobsmacked by the inventiveness of teh programmers who entered. We will be looking in more depth at what has been produced. We are also seeking feedback from all those who participated and planning more events later in the year. If you would like to know more (and particularly we would be interested in similar approaches to Open data for Labour Market Information in other countries) please contact me at graham10 [at] mac [dot] com.

Citing and valueing Open Data

July 2nd, 2013 by Graham Attwell

The academic world has. perhaps unsurprisingly, been somewhat slow to respond to the challenge of recognising different sources of knowledge. A little strangely, one important step in developing recognition of different forms of scholarly research and knowledge is the development and use of forms of citation.

Si in that regard it is encouraging to see the publication of “The Amsterdam Manifesto on Data Citation Principles.”

In the preface they state:

We wish to promote best practices in data citation to facilitate access to data sets and to enable attribution and reward for those who publish data. Through formal data citation, the contributions to science by those that share their data will be recognized and potentially rewarded. To that end, we propose that:

1. Data should be considered citable products of research.

2. Such data should be held in persistent public repositories.

3. If a publication is based on data not included with the article, those data should be cited in the publication.

4. A data citation in a publication should resemble a bibliographic citation and be located in the publication’s reference list.

5. Such a data citation should include a unique persistent identifier (a DataCite DOI recommended, or other persistent identifiers already in use within the community).

6. The identifier should resolve to a page that either provides direct access to the data or information concerning its accessibility. Ideally, that landing page should be machine-actionable to promote interoperability of the data.

7. If the data are available in different versions, the identifier should provide a method to access the previous or related versions.

8. Data citation should facilitate attribution of credit to all contributors

The Manifesto was created during the Beyond the PDF 2 Conference in Amsterdam in March 2013.

The original authors were Mercè Crosas, Todd Carpenter, David Shotton and Christine Borgman.


Big data, issues and policies

June 21st, 2013 by Graham Attwell

I’ve been working this week on a report on data. I am part of a small team and the bit they have asked me to do is the use of big data, and particularly geo-spatial data, for governments. I am surprised by how much use is already being made of data, although patterns seem very uneven. We did a quick brainstorm in the office of potential areas where data could impact on government services and came up with the following areas:

  • Transport

– infrastructure and maintenance

  • Council Services

– planning

– Markets/Commerce

– Licenses

  • Environmental Services

– Waste and Recycling

– Protection

– Climate

– Woodlands

– Power monitoring

– Real – time monitoring

  • Health Services
  • Planning
  • Employment
  • Education
  • Social Services
  • Tourism
  • Heritage Services
  • Recreational Services
  • Disaster response
  • Disease analysis
  • Location tracking
  • Risk management/ modelling
  • Crime prevention
  • Service Management
  • Target achievements
  • Predictive maintenance

There seems little doubt that using more data could allow national, regional and local governments both to design more effective, efficient and personalised services. However there remain considerable issues and barriers to this development. These include:

  • Lack of skills and knowledge in government staff. There are already predictions of skills shortages for data programmers and analysts. With the rapid expansion in the use of big data in the private sector, the relatively lower levels of local government remuneration may make it difficult to recruit staff with the necessary knowledge and skills.
  • Pressure on public sector budgets. Although there are considerable potential cost savings through the use of big data in planning and providing services, this may require considerable up front investment in research and development. With the present pressure on public sector budgets there is a challenge in securing sufficient resources in this area. Lack of time to develop new systems and services
  • Lock-in to proprietary systems. Although many of the applications being developed are based on Open Source Software, there is a danger that in contracting through the private sector, government organisations and agencies will be locked into proprietary approaches and systems.
  • Privacy and Security. There is a general societal issue over data privacy and security. Obviously the more data available, the grater the potential for developing better and cost effective services. At the same time the deeper the linking of data, the more likely is it that data will be disclosive.
  • Data Quality and Compatibility. There would appear to be a wide variety in the quality of the different data sets presently available. Furthermore, the format of much published government data renders its use problematic. There is a need for open standards to ensure compatibility.
  • Data ownership. Even in the limited field of GIS data there are a wide range of different organisations who own or supply data. This may include public agencies, but also for instance utility and telecoms companies. They may not wish to share data or may wish to charge for this data.
  • Procurement regulations. Whilst much of the innovation in the use of data comes from Small and Medium Enterprises, procurement regulations and Framework Contracts tend to exclude these organisations from tendering for contracts.


  • Search Pontydysgu.org

    Social Media


    News Bites

    Cyborg patented?

    Forbes reports that Microsoft has obtained a patent for a “conversational chatbot of a specific person” created from images, recordings, participation in social networks, emails, letters, etc., coupled with the possible generation of a 2D or 3D model of the person.


    Racial bias in algorithms

    From the UK Open Data Institute’s Week in Data newsletter

    This week, Twitter apologised for racial bias within its image-cropping algorithm. The feature is designed to automatically crop images to highlight focal points – including faces. But, Twitter users discovered that, in practice, white faces were focused on, and black faces were cropped out. And, Twitter isn’t the only platform struggling with its algorithm – YouTube has also announced plans to bring back higher levels of human moderation for removing content, after its AI-centred approach resulted in over-censorship, with videos being removed at far higher rates than with human moderators.


    Gap between rich and poor university students widest for 12 years

    Via The Canary.

    The gap between poor students and their more affluent peers attending university has widened to its largest point for 12 years, according to data published by the Department for Education (DfE).

    Better-off pupils are significantly more likely to go to university than their more disadvantaged peers. And the gap between the two groups – 18.8 percentage points – is the widest it’s been since 2006/07.

    The latest statistics show that 26.3% of pupils eligible for FSMs went on to university in 2018/19, compared with 45.1% of those who did not receive free meals. Only 12.7% of white British males who were eligible for FSMs went to university by the age of 19. The progression rate has fallen slightly for the first time since 2011/12, according to the DfE analysis.


    Quality Training

    From Raconteur. A recent report by global learning consultancy Kineo examined the learning intentions of 8,000 employees across 13 different industries. It found a huge gap between the quality of training offered and the needs of employees. Of those surveyed, 85 per cent said they , with only 16 per cent of employees finding the learning programmes offered by their employers effective.


    Other Pontydysgu Spaces

    • Pontydysgu on the Web

      pbwiki
      Our Wikispace for teaching and learning
      Sounds of the Bazaar Radio LIVE
      Join our Sounds of the Bazaar Facebook goup. Just click on the logo above.

      We will be at Online Educa Berlin 2015. See the info above. The stream URL to play in your application is Stream URL or go to our new stream webpage here SoB Stream Page.

  • Twitter

  • Recent Posts

  • Archives

  • Meta

  • Categories